Marathon Training: How the Body AdaptsChapter 1
Endurance and Adaptation
In this chapter
This chapter gives you the physiology behind a marathon — how the body pays for hours of running, what caps how much oxygen it can use, why the pace it can hold sits below that cap, what it costs to cover a kilometre — and the two ideas that turn physiology into a season: why fitness is built between sessions rather than during them, and why a plan rises for months and then eases. It teaches what the , , the , , and are; it does not tell you how to train, eat or drink, or what to do about your own body.
Three Energy Systems Pay for Every Stride at Once
Every muscle contraction is paid for in adenosine triphosphate (ATP (adenosine triphosphate)), of which a muscle stores only a few seconds' worth; three energy systems remake it continuously — the phosphagen system, glycolysis, and mitochondrial oxidation of carbohydrate and fat.
Ask how hard and how long: all three run at once from the first stride; intensity and duration set the mix. The phosphagen system is fastest and spent within about ten seconds; glycolysis peaks within fifteen, produces lactate, and carries efforts of half a minute to two minutes; oxidation is slowest per second but runs for hours.
In one estimate a maximal 10-second sprint draws about half its energy from the phosphagen system and almost none from oxidation; a 30-second sprint draws about a quarter from oxidation; a marathon, held for hours, runs almost entirely on it.
"The body switches systems like gears — one at a time." All three contribute from the start; only their shares change. "A marathon is slow, so it burns fat and doesn't need carbohydrate." Slower running burns more fat, but at marathon intensity carbohydrate still supplies much of the energy — the one fuel that can run short. "'Anaerobic' means the muscle ran out of oxygen." Glycolysis makes lactate whenever it runs fast, whatever the oxygen supply.
Maximal Oxygen Uptake Is the Ceiling, Not the Race
Maximal oxygen uptake (VO₂max (maximal oxygen uptake)) is the highest rate at which the body can take up and use oxygen — the ceiling of the oxidative system. It equals maximal cardiac output multiplied by the oxygen extracted from each litre of blood.
In a graded test, oxygen uptake rises with speed until it plateaus though speed still rises; the plateau is the ceiling. To find what limits it, follow the oxygen from air to muscle. In healthy trained people it is delivery: alter the oxygen carried or pumped and the ceiling moves with it, and training raises it mostly through a bigger stroke volume and cardiac output.
In the HERITAGE Family Study, 481 sedentary adults followed one 20-week programme: VO₂max (maximal oxygen uptake) rose about 400 mL/min on average, yet some gained almost nothing, others more than 1 L/min, and the response ran in families.
"It's limited by the lungs — you can't get enough air in." Breathing can rise more than tenfold; the ceiling is set chiefly by how much oxygen the heart delivers. "The highest VO₂max (maximal oxygen uptake) wins." It is a ceiling, not the race: the fraction held and the oxygen each kilometre costs decide who is faster beneath it. "Same training, same gain." Gains on one programme range from near zero to more than 40 %.
The Lactate Threshold Is the Sustainable Pace
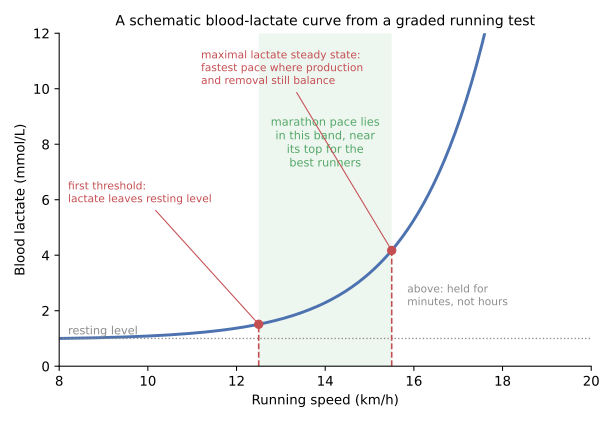
The lactate threshold is the intensity at which blood lactate first rises above resting level; higher up lies the maximal lactate steady state, the fastest pace at which lactate production and removal still balance.
Plot blood lactate against speed in a graded test: flat, a first rise, then a climb without end. The highest steady state marks about the sustainable pace — hours, not minutes — and training moves it to a higher fraction of even when the ceiling does not move: about 60 % in sedentary people, 75–85 % in elite endurance athletes.
Sixteen world-class male runners tested for Breaking2: mean VO₂max (maximal oxygen uptake) 71 mL/kg/min, first lactate rise at 18.9 km/h (83 % of it), lactate turn-point at 20.2 km/h (92 %); two-hour marathon pace, 21.1 km/h, lay just above both.
"Lactic acid is waste — it causes the burn and next-day soreness." Lactate is a fuel, burned by muscle and heart; its rise marks glycolysis outrunning removal, and next-day soreness is fibre damage, mostly after downhill running. "Past the threshold the muscle has run out of oxygen." Glycolysis makes lactate whenever it runs fast, whatever the oxygen supply. "It's a fixed number — 4 mmol per litre." One of many conventions for locating it; the physiology is the balance, not the number.
Running Economy Is the Oxygen Cost of a Kilometre
Running economy is the steady-state oxygen uptake at a given submaximal speed — the oxygen cost of a kilometre; a runner with better economy uses less oxygen at the same speed.
Measure oxygen uptake while a runner holds a fixed speed below the for several minutes, per kilogram per minute or per kilometre; compare runners only at the same speed. Among trained runners with similar VO₂max (maximal oxygen uptake), economy varies by as much as 30 % and predicts performance where ceilings are alike. Anything that changes the oxygen bill counts: fibres and mitochondria, breathing and heart work, stride mechanics and tendon elasticity, muscle recruitment.
Paula Radcliffe's economy improved by about 15 % between 1992 and 2003 while her VO₂max (maximal oxygen uptake) stayed essentially stable — the years in which she set the women's marathon record, 2:15:25.
"Same VO₂max (maximal oxygen uptake), same speed." Same ceiling, economy differing by nearly a third; the more economical runner is faster at every fraction of it. "Economy is just form — fix the stride." Runners settle into their most economical stride unprompted, and measured links between form and economy are small to moderate; muscle, tendons and the cost of breathing count too. "Once VO₂max (maximal oxygen uptake) stops rising, you've peaked." Economy keeps improving with years of running after the ceiling has stopped moving.
The Breaking2 laboratory data show how economy, the ceiling and the threshold combine into a pace. Hypothetical arithmetic on the published means:
- Take the measured oxygen cost. The seven athletes who reached a steady state outdoors at 21.1 km/h used on average 191 mL of oxygen per kilogram per kilometre.
- Turn the speed into kilometres per minute. km per minute.
- Multiply cost by speed to get the oxygen demand. mL/kg/min is what that pace costs.
- Compare the demand with the ceiling and the threshold. Against a mean VO₂max (maximal oxygen uptake) of 71 mL/kg/min, : two-hour pace demanded about 95 % of the ceiling, above the group's lactate turn-point of 92 % — consistent with only seven of the sixteen attaining a steady state at it, and showing why the pace needs an unusually high ceiling, an unusually high sustainable fraction and unusually good economy at once.
The common slip is at step 1: comparing two runners' economy at different speeds — the cost per kilometre changes with speed, so the comparison only means something at the same one.
Overload, Recovery and Supercompensation: Fitness Is Built Between Sessions
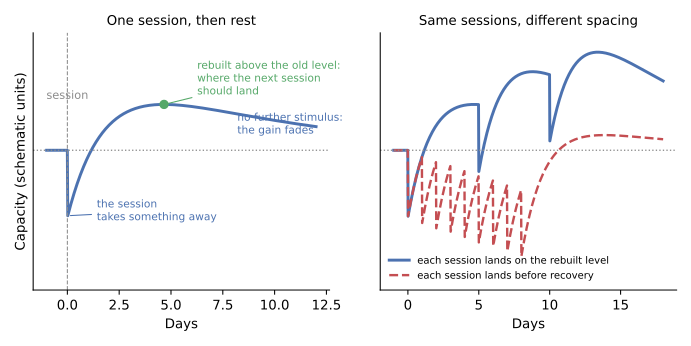
Overload is a session that asks more of the body than it is used to; supercompensation is the rebuilding, during the recovery after it, to slightly above the old level. Adaptation is made between sessions, not during them.
After a session, ask what was disturbed and what is being rebuilt: fuel, fibres, mitochondria, capillaries, stroke volume. Then ask three things of the pattern: whether each overload is a little more than the last (progression), whether it stresses what the race demands (specificity), and whether the stimulus continues (reversibility). A session on unfinished recovery stacks fatigue; one on the rebuilt level stacks fitness.
Six months of endurance training typically raises a sedentary adult's VO₂max (maximal oxygen uptake) 15–20 %; among men and women aged 60–71 who trained for 9–12 months, gains ranged from 0 to 43 %. Each is built one recovery at a time.
"You get fitter during the workout." Right after a hard session the body is depleted and slower; the rebuilding above the old level comes in the days after. "More is always better; rest days are lost days." Recovery is where adaptation is made; injuries cluster where load rises fast. "Fitness stays once built." VO₂max (maximal oxygen uptake) and plasma volume fall within two weeks of stopping; gains are largely gone in two to eight months.
The maintenance experiments of Hickson's laboratory, reported in the Surgeon General's review, show which part of a session holds what it built. People who had raised their VO₂max (maximal oxygen uptake) by training six times a week kept the gain when they cut to two to four sessions a week; a substantial part of the gain was also kept when each session's duration was cut by as much as two-thirds — but only if the intensity of the shortened sessions was maintained; and when intensity was cut by as little as one-third, a substantial fall in VO₂max (maximal oxygen uptake) followed over the next 15 weeks. Frequency and duration can be reduced; the intensity is what the adaptation answers to.
Periodization and the Taper Arrange Load So the Peak Lands on Race Day
Periodization is the arrangement of training load over months into phases — commonly a general phase of rising volume, a specific phase nearer race pace, and a taper — so that overload and recovery add up to a peak on race day.
Read any plan as stretched over months: volume rises first, then the emphasis shifts toward race pace. The taper is the last step: over 2–3 weeks volume falls by about 40–60 % while intensity and frequency are kept, so fatigue drains faster than fitness — worth about 1–3 % in well-trained endurance athletes.
World-class marathon runners in one review periodized around a spring and an autumn marathon, took 7–14 days easy after each, split the 5–6 months before a race into general and specific preparation, and cut volume sharply only in the last 7–10 days.
"Cutting back means losing fitness — cram the missing long runs." Reversibility takes weeks; a taper of days sheds fatigue while fitness is kept, by the intense sessions. "The taper is just rest." Cutting intensity by a third costs VO₂max (maximal oxygen uptake) within weeks; the taper cuts volume and keeps intensity. "There is one proven plan." Comparisons of periodization structures mostly find equivalent gains; no direct evidence ranks the models.
One Race, Six IdeasSynthesis
One last hypothetical: Yara's marathon, read through the chapter. Over its three and a half hours her muscles are paid almost entirely by oxidation — the — with her glycogen the one fuel that could run short late on. How much oxygen she can use at most is her , set chiefly by her heart's output; it caps her, and it does not decide her time. The pace she holds sits near her , the fastest speed at which lactate production and removal still balance, and what each kilometre costs her at that pace is her — two runners with her ceiling could finish many minutes apart on those alone.
None of it was made on race day. Every capacity she brings was built in the recoveries between sessions over months, each session an that lowered her before it raised her, and the season that arranged those sessions — volume first, race pace later, and a taper that let fatigue drain while fitness stayed — is . Six ideas, one race; how her season was shaped is a coach's question, and why it was shaped that way is this chapter's.
Sources
- 1 U.S. Department of Health and Human Services, Physical Activity and Health: A Report of the Surgeon General (Atlanta: CDC, 1996), Chapter 3 'Physiologic Responses and Long-Term Adaptations to Exercise', pp. 61–77 — public domain (U.S. Government work); read in the ERIC full-text copy — source
- 2 U.S. Department of Health and Human Services, Physical Activity Guidelines for Americans, 2nd edition (Washington, DC: HHS, 2018), Chapter 2 box 'It Is About Overload, Progression, and Specificity', Chapter 7 'Increase Physical Activity Gradually Over Time', and the Glossary — public domain (U.S. Government work) — source
- 3 Kyle R. Barnes & Andrew E. Kilding, 'Running economy: measurement, norms, and determining factors', Sports Medicine – Open 1:8 (2015), doi:10.1186/s40798-015-0007-y — CC BY 4.0 — source
- 4 Thomas Haugen, Øyvind Sandbakk, Stephen Seiler & Espen Tønnessen, 'The Training Characteristics of World-Class Distance Runners: An Integration of Scientific Literature and Results-Proven Practice', Sports Medicine – Open 8:46 (2022), doi:10.1186/s40798-022-00438-7 — CC BY 4.0 — source
- 5 Julien S. Baker, Marie Clare McCormick & Robert A. Robergs, 'Interaction among Skeletal Muscle Metabolic Energy Systems during Intense Exercise', Journal of Nutrition and Metabolism 2010:905612, doi:10.1155/2010/905612 — CC BY — source
- 6 Benjamin I. Rapoport, 'Metabolic Factors Limiting Performance in Marathon Runners', PLoS Computational Biology 6(10):e1000960 (2010), doi:10.1371/journal.pcbi.1000960 — CC BY 4.0 — source
- 7 Regula Furrer, John A. Hawley & Christoph Handschin, 'The molecular athlete: exercise physiology from mechanisms to medals', Physiological Reviews 103(3):1693–1787 (2023), doi:10.1152/physrev.00017.2022 — CC BY 4.0; §2.1 (principles of training), §3.1 (oxygen transport and VO₂max, Table 1) and §3.6 (how adaptation is brought about) — source
- 8 Hermann Heck & Henning Wackerhage, 'The origin of the maximal lactate steady state (MLSS)', BMC Sports Science, Medicine and Rehabilitation 16:36 (2024), doi:10.1186/s13102-024-00827-3 — CC BY 4.0 — source
- 9 Gustavo Z. Schaun, 'The Maximal Oxygen Uptake Verification Phase: a Light at the End of the Tunnel?', Sports Medicine – Open 3:44 (2017), doi:10.1186/s40798-017-0112-1 — CC BY 4.0 — source
- 10 John Kiely, 'Periodization Theory: Confronting an Inconvenient Truth', Sports Medicine 48:753–764 (2018), doi:10.1007/s40279-017-0823-y — CC BY 4.0 — source
- 11 Jules A. A. C. Heuberger et al., 'Repeatability and predictive value of lactate threshold concepts in endurance sports', PLoS ONE 13(11):e0206846 (2018), doi:10.1371/journal.pone.0206846 — CC BY — source
- 12 David R. Bassett Jr & Edward T. Howley, 'Limiting factors for maximum oxygen uptake and determinants of endurance performance', Medicine & Science in Sports & Exercise 32(1):70–84 (2000), doi:10.1097/00005768-200001000-00012 (consulted — the abstract's three lines of evidence for the delivery limitation, and 'speed at LT is the best physiological predictor') — source
- 13 Claude Bouchard et al., 'Familial aggregation of VO2max response to exercise training: results from the HERITAGE Family Study', Journal of Applied Physiology 87(3):1003–1008 (1999), doi:10.1152/jappl.1999.87.3.1003 (consulted — the numbers in the abstract) — source
- 14 Andrew M. Jones, 'The Physiology of the World Record Holder for the Women's Marathon', International Journal of Sports Science & Coaching 1(2):101–116 (2006), doi:10.1260/174795406777641258 (consulted — the abstract: 15 % improvement in running economy between 1992 and 2003; 2:15:25) — source
- 15 Andrew M. Jones et al., 'Physiological demands of running at 2-hour marathon race pace', Journal of Applied Physiology 130(2):369–379 (2021), doi:10.1152/japplphysiol.00647.2020 (consulted — the abstract's numbers for the sixteen Breaking2 athletes) — source
- 16 Shona L. Halson, 'Monitoring Training Load to Understand Fatigue in Athletes', Sports Medicine 44 Suppl 2:139–147 (2014), doi:10.1007/s40279-014-0253-z (consulted — external versus internal load) — source
- 17 David C. Poole, Harry B. Rossiter, George A. Brooks & L. Bruce Gladden, 'The anaerobic threshold: 50+ years of controversy', Journal of Physiology 599(3):737–767 (2021), doi:10.1113/JP279963 (consulted — named for the naming controversy; not adapted) — source
- 18 OpenStax Anatomy and Physiology 2e §10.3: Muscle Fiber Contraction and Relaxation (consulted only — CC BY-NC-SA 4.0 at the source on 2026-08-19, not adapted; the ATP-source durations) — source
- 19 Wikipedia, 'Breaking2' (consulted for the date and finishing time of the Monza run) — source